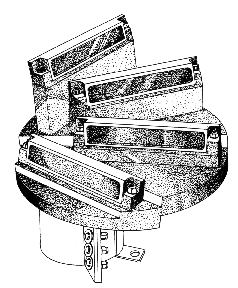
Figure 1. The fan-beam ADCP transducer head.
The combined action of wind and wave forcing at the ocean surface leads to several effects not anticipated when considering the wind alone. One of these effects is the injection of microbubbles (20-400 micron radius) into the upper few meters of the ocean by breaking waves. It has been recognized that these bubbles are strong acoustic targets and can be used to image the ocean surface in a manner analogous to sidescan sonar imaging of the ocean bottom [1,2]. Adding Doppler processing capability allows detection of the surface velocity as well as the intensity [3,4].
Another effect of wind and wave forcing is the development of coherent structures in the oceanic mixed layer. Under favorable conditions (relatively strong winds with waves propagating in the same direction as the wind) a sequence of counter-rotating cells known as Langmuir circulation is often observed [5]. The cells have their axis of rotation roughly aligned with the wind direction. The largest cells have a vertical scale approximately equal to the mixed layer depth and an aspect ratio (width/depth) of 1.0 to 1.5. The downwind extent of the cells is usually many times their depth.
At the sea surface, Langmuir cells create convergence zones which collect microbubbles (or any buoyant objects) into rows parallel to the wind direction. Langmuir circulation can be detected either by measuring the convergent velocities directly or by observing the bands of enhanced intensity due to bubbles collected in the convergence zones.
We were interested in exploiting the acoustic imaging techniques pioneered by previous investigators [1-3] in order to develop a self-contained (i.e. battery powered and internally recording) instrument which could be deployed for up to six months from a conventional mooring. The goal was to obtain the first long-term record of Langmuir circulation strength in conjunction with wind and wave forcing. The instrument would be based on readily available Acoustic Doppler Current Profiler (ADCP) electronics in an effort to make these capabilities available to a broad group of users. The opportunity to develop the instrument and to obtain field data was provided by the Coastal Mixing and Optics (CMO) Experiment, conducted on the New England Shelf in 1996-97.
Figure 1. The fan-beam ADCP transducer head.
The instrument consisted of standard RD Instruments 300 kHz BroadBand ADCP electronics attached to a specially designed transducer head (Figure 1). Four bar-shaped transducers (approximately 250 mm by 45 mm by 10 mm) were oriented so that the beams were narrow (3 degrees) in azimuth and broad (24 degrees) in elevation. Thus, the beams had an approximate "fan" shape in the vertical plane. The beam center lines were angled upwards by 12 degrees and separated by 30 degree increments in azimuth.
The fan-beam ADCP was deployed in 70 m of water during 17 weeks in the fall of 1996 (Oct-Jan) and 8 weeks in the spring of 1997 (Apr-Jun) as a part of the CMO Experiment. The instrument was housed within a 60 inch syntactic foam sphere which was the uppermost element (at 30 m depth) of a subsurface mooring. A mounting plate and collar held the instrument vertically with the transducer head on top.
A burst sampling scheme was used to conserve power and reduce data storage requirements. At the start of a burst a sequence of 37 acoustic pulses (pings) separated by 1.3 seconds was transmitted. These pulses were averaged together to form one ensemble which was recorded to memory. A total of 20 ensembles separated by 1 min were recorded during each 20 min burst. The burst repetition time was one hour, and the burst interval was centered on the hour.
The instrument operated successfully during the two CMO deployments, providing surface velocities with spatial resolution of about 4 m, horizontal range of up to 160 m, and velocity precision of about 2 cm/s.
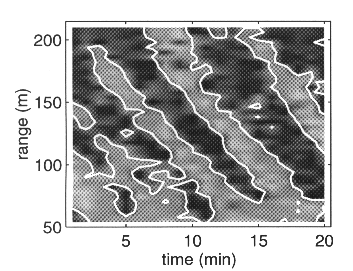
Figure 2. Surface velocity vs.
range and time for a 20 min interval centered on 1400 UTC, 03 November
1996. The gray scale is from -10 to 10 cm/s. A contour line is plotted
at zero.
Figure 2 shows a 20 min segment of data when Langmuir circulation was strong. Velocity data are presented in a time-range plot from a beam pointing approximately crosswind. Clearly defined convergence zones with 6-8 cm/s peak velocities are seen in the plot. A mean crosswind velocity of about 20 cm/s during the observation period caused the convergence zones to move closer to the instrument over time, producing a sequence of stripes oriented at an angle. The stripe spacing of about 60 m indicates 30 m wide Langmuir cells, consistent with the mixed layer depth of 25-30 m during the observation period.
Further investigation of the fan-beam ADCP data in relation to the magnitude and direction of wind and wave forcing is in progress.
The fan-beam ADCP was conceived by A. Plueddemann and E. Terray. The transducer head was developed by R. Merewether of RD Instruments. The CMO deployments were made possible by R. Trask, W. Ostrom and B. Way. The contributions of M. Levine, D. Simoneau, R. Watts, A. Williams, and S. Worrilow are greatly appreciated. Funding was provided by the Office of Naval Research, Code 322PO.
[1] Thorpe, S.A. and A.J. Hall, 1983. The characteristics of breaking waves, bubble clouds, and near-surface currents observed using side-scan sonar, Continental Shelf Research, 1(4), 353-384.
[2] Zedel, L. and D. Farmer, 1991. Organized structures in subsurface bubble clouds: Langmuir circulation in the open ocean, Journal of Geophysical Research, 96(C5), 8889-8900.
[3] Smith, J.A., R. Pinkel and R.A. Weller, 1987. Velocity structure in the mixed layer during MILDEX, Journal of Physical Oceanography, 17, 425-439.
[4] Plueddemann, A.J., J.A. Smith, D.M. Farmer, R.A. Weller, W.R. Crawford, R. Pinkel, S.Vagle and A. Gnanadesikan, 1996. Structure and variability of Langmuir circulation during the Surface Waves Processes Program, Journal of Geophysical Research, 101(C2), 3525-3543.
[5] Leibovich, S.A., 1983. The form and dynamics of Langmuir circulation, Annual Reviews of Fluid Mechanics, 15, 391-427.
Dr. Albert J. Plueddemann is an associate scientist in the Physical Oceanography Department and member of the Upper Ocean Processes Group at the Woods Hole Oceanographic Institution.
 Return to UOP Homepage