Project Stratus
| Sponsors |
 Principal funding is provided by NOAA Climate Program Office.
(CPO). Principal funding is provided by NOAA Climate Program Office.
(CPO). |
| Stratus Real Time Data Products |
| Real time vs historical data |
| Surface fluxes |
| Real time data vs model outputs |
Introduction
In-situ observations of atmospheric and oceanic conditions near and below the ocean surface have been gathered for over 10 years from a research buoy located at 85 °W 20 ´S in the subtropical Pacific. This region of the world is characterized by a persistent presence of low clouds (stratus deck) which prevented accurate remote sensing from early satellites and led to errors in computer simulations of the oceanic state.
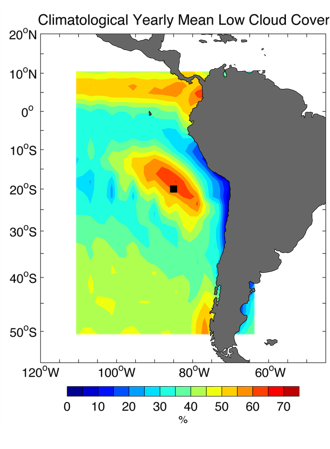
To remediate the lack of accurate observations in this region, a surface mooring has been deployed there since 2000. On this mooring, named Ocean Sites Stratus (hereafter Stratus), data are sampled every minute. The measurements are acquired by ASIMET sensors, a set of sensors with climate quality (Weller and Colbo 2009).
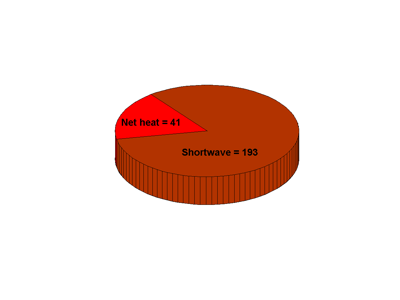
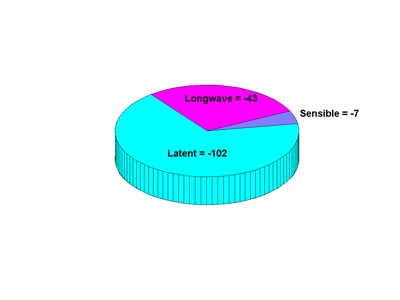
Thanks to these measurements and the use of state of the art bulk parameterization COARE 3.5 (Fairall et al., 1996, 2003, Edson et al., 2012), the heat and momentum fluxes are derived from the meteorological measurements. After more than 10 years of data collection we are now able to estimate with great accuracy how much heat is exchanged between the ocean and the atmosphere in this region of the world. It turns out that despite the permanent stratus deck, enough solar radiation reaches down to heat the ocean on average each year (41 Wm-2), as decribed in the pie charts below.
 |
 |
Methodology
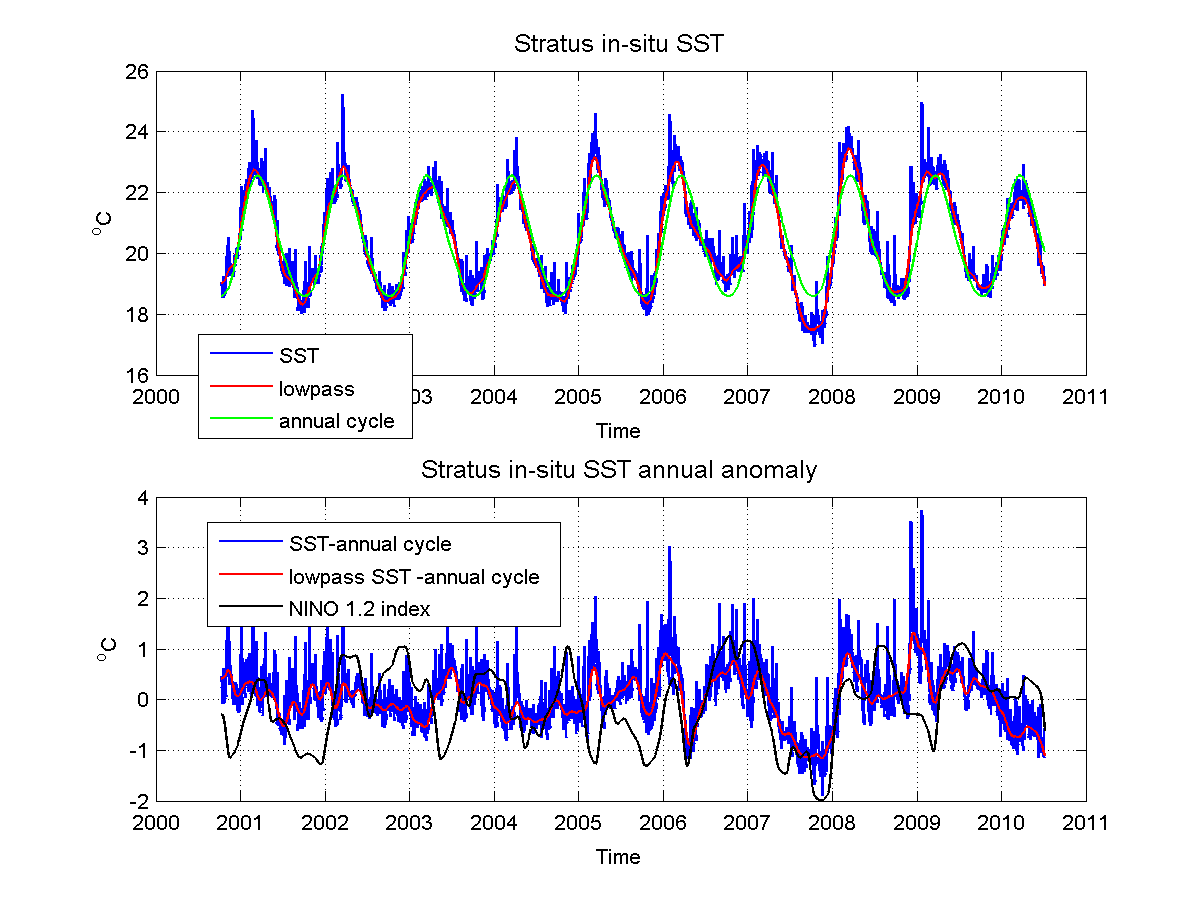
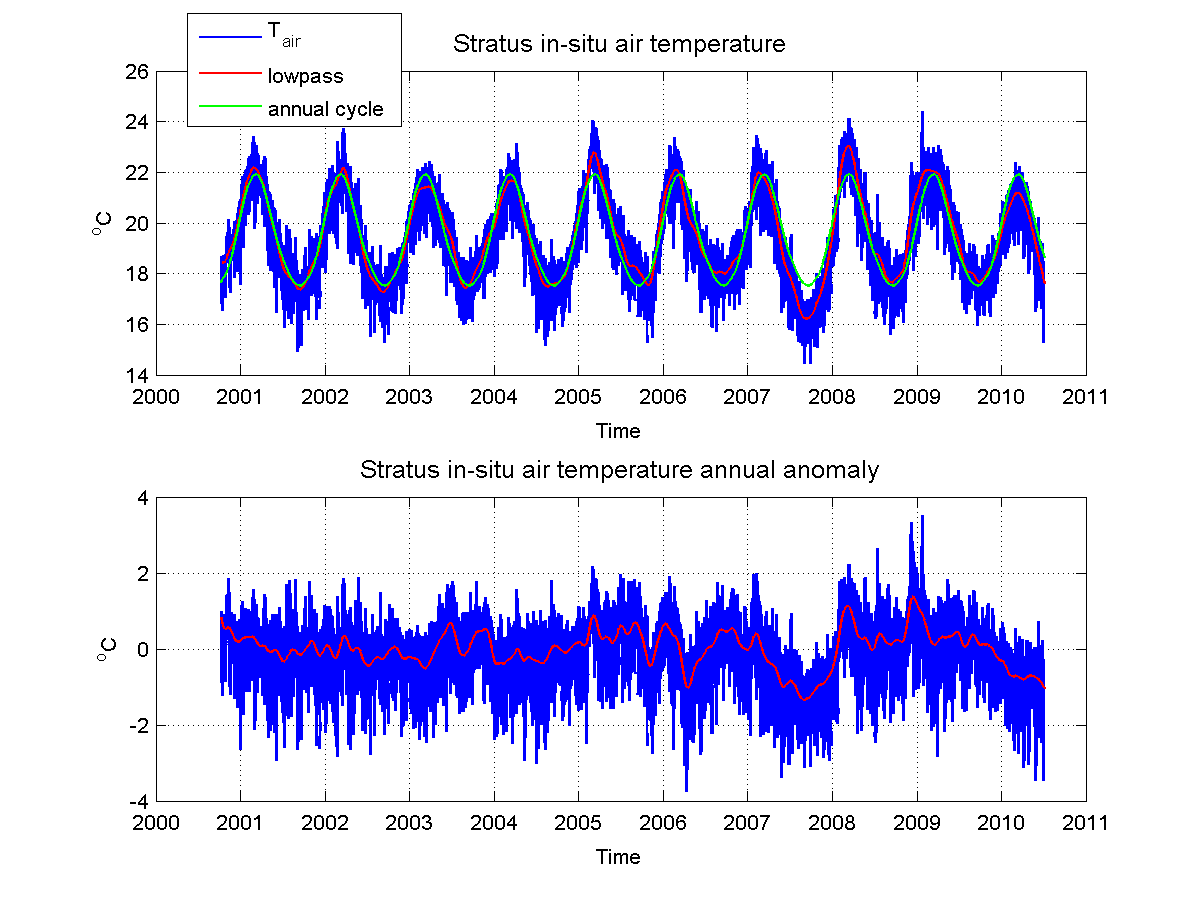
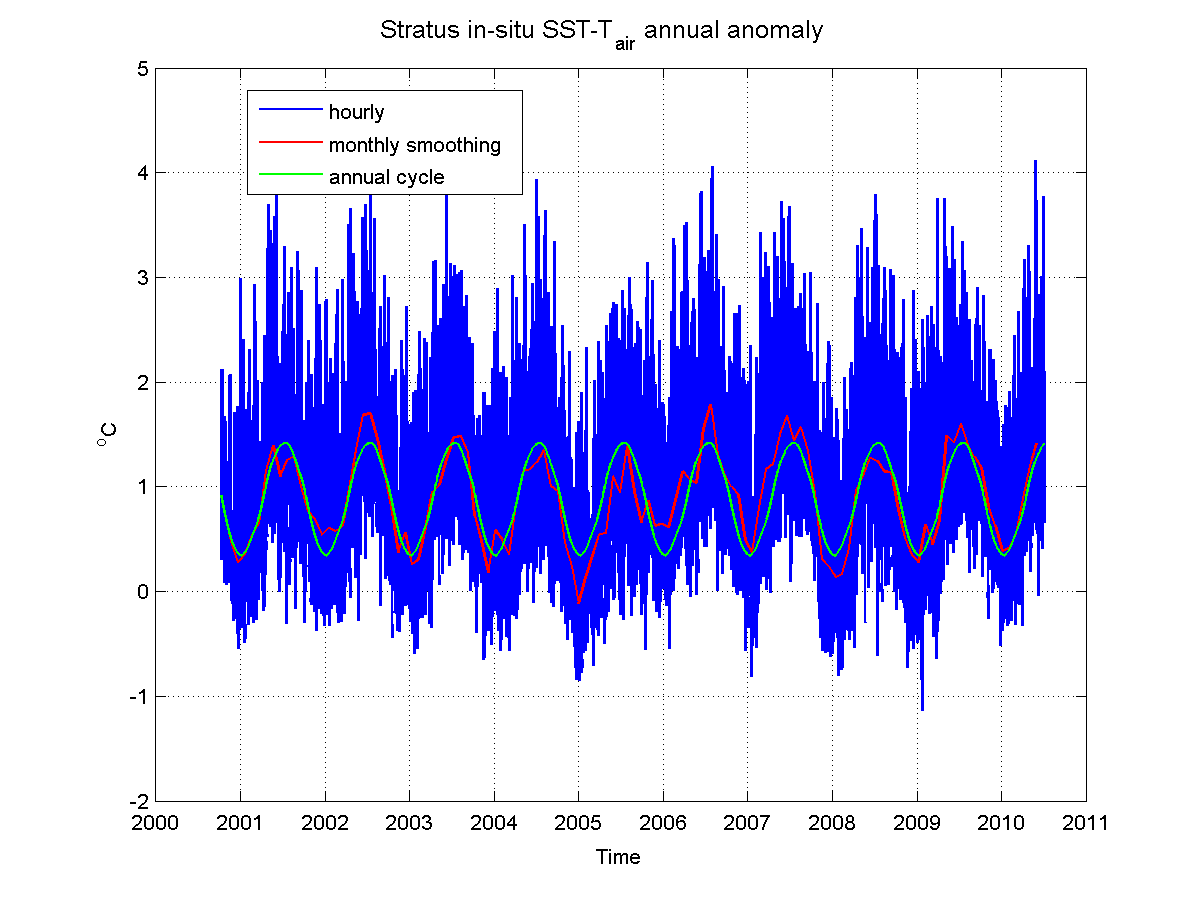
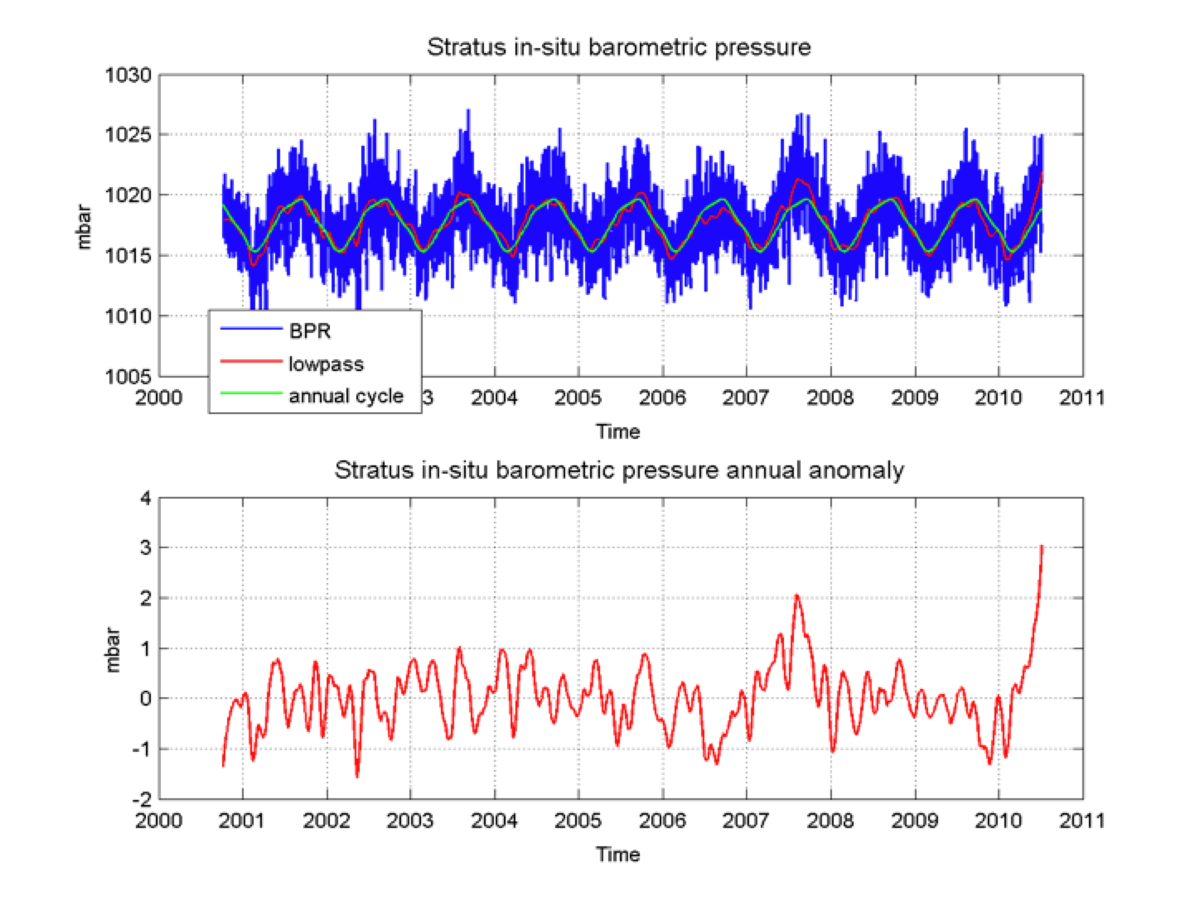
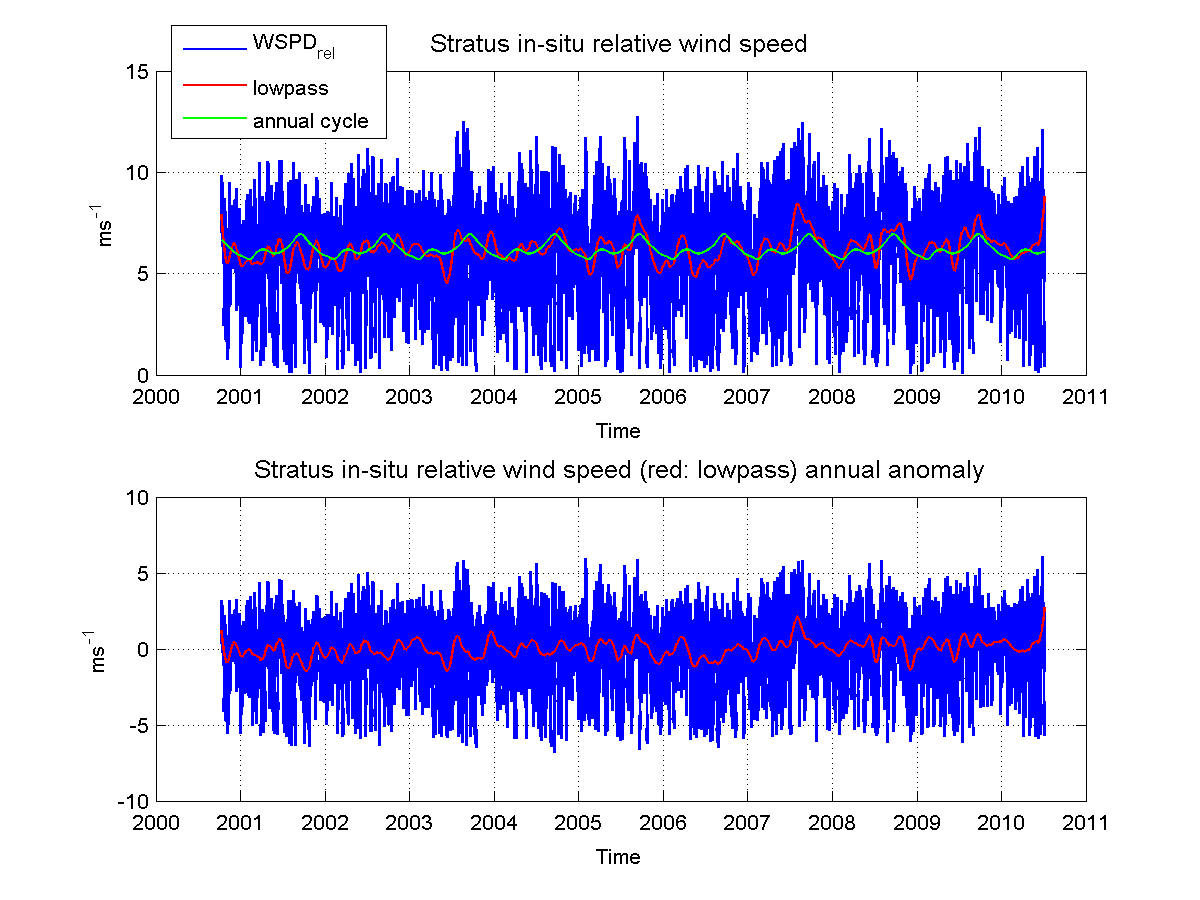
In the figures below, 1-minute in situ data were averaged to hourly values (blue), a 30 days moving average was applied to data (red) and the annual cycle (green) was computed by averaging monthly averages over 10 years.
Plots
Observations show that the interannual variations seen in SST are also present in atmospheric proxies, like air temperature (Figure 2), barometric pressure (Figure 4) or wind speed (Figure 5). In 2007, air temperature was colder, pressure higher and winds stronger. The atmosphere and the ocean are not in thermal equilibrium, as their response times to seasonal forcing differ. In figure 3, the difference between SST and air temperature is very seasonal indeed, but again, the inequilibrium was enhanced in 2007.
Last updated: 2022/03/16


