Project Stratus
Stratus Science Results
Historical Data
Comparing real-time with the historical annual cycle
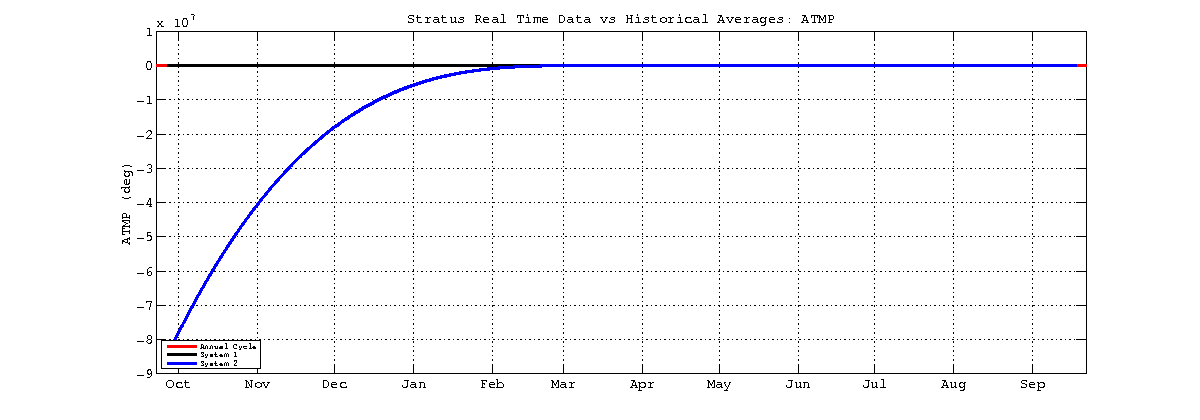
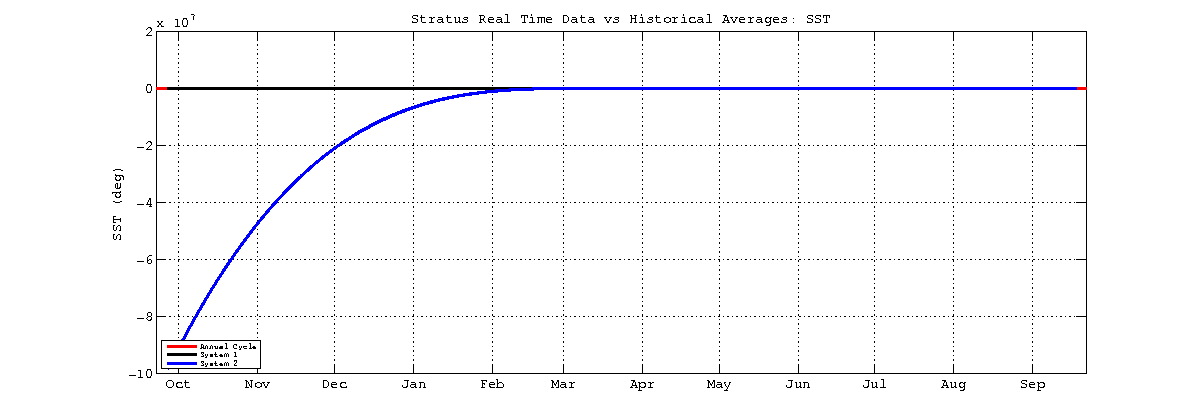
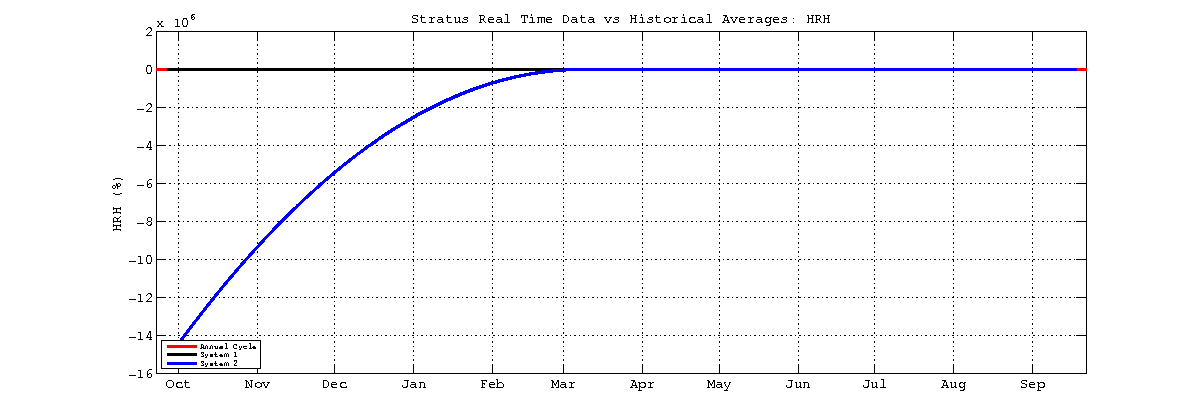
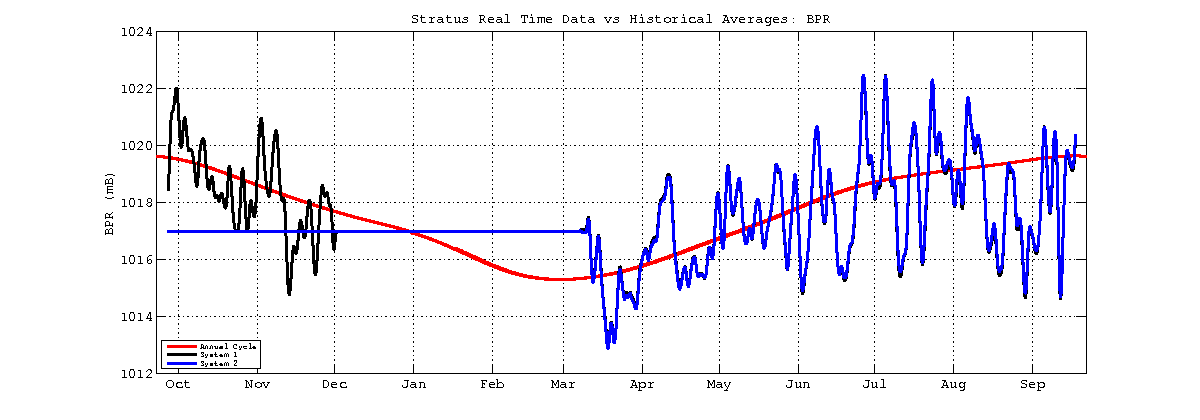
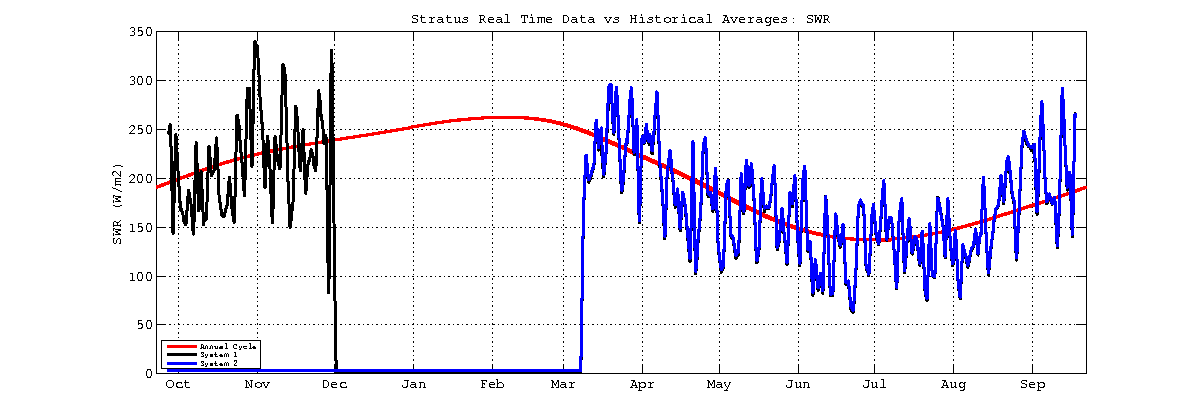
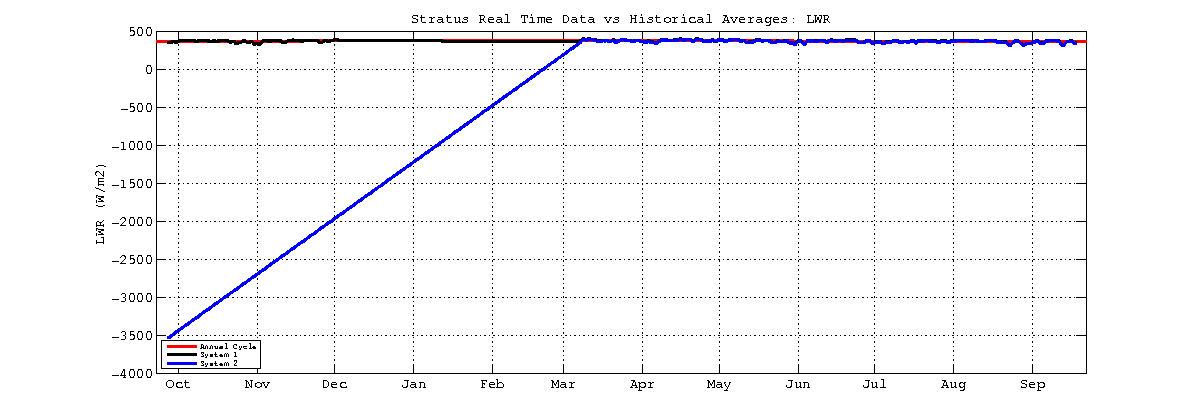
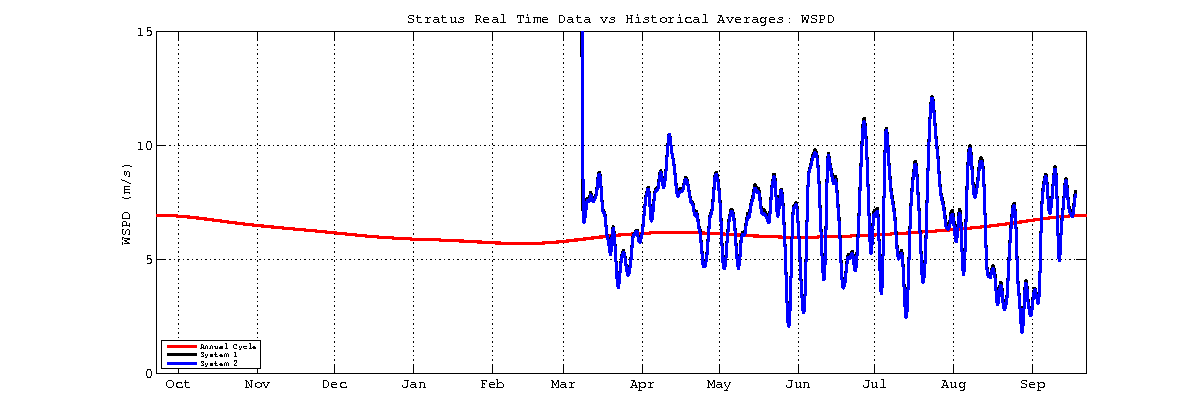
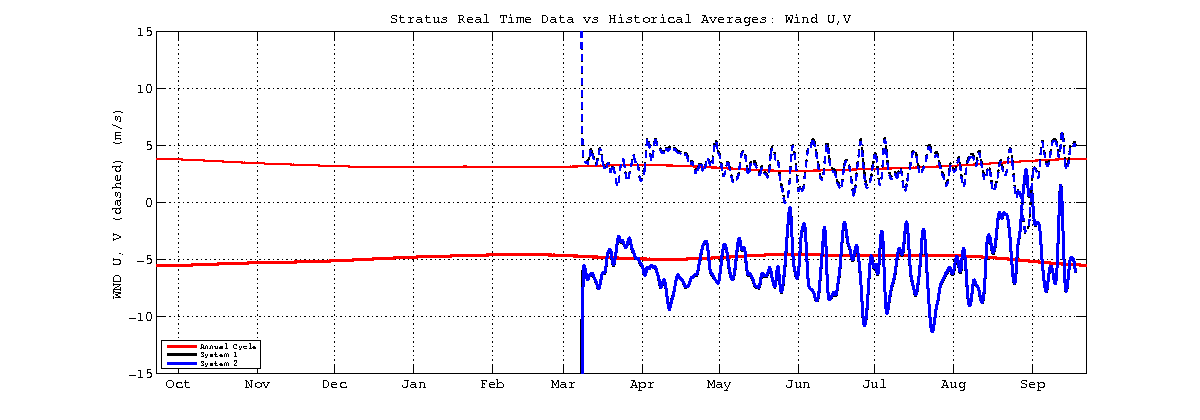
Based on 10 years of data from the ASIMET sensors on the Stratus Ocean Reference Site (ORS) surface mooring, we have computed the annual cycle for each of the variables measured on the buoy. These climatological datasets are compared with the real time values being transmitted from the buoy now.
Methodology
The annual cycle is generated by first computing monthly averages over the 10 year dataset, using quality controlled, one-minute, internally-recorded data that has been corrected for sensor and clock drift, using post-calibrations and a variety of quality control procedures. For each month of the year an average is calculated from the 10 values available; the final monthly values are then interpolated back to hourly values.
Real-time data from the currently deployed mooring is transmitted back to land through Argos satellite telemetry. Two redundant systems on the mooring send hourly averages of the raw in-situ data. These data are subjected to minimal quality control, consisting of removal of outliers; no bias or drift correction is made. A daily moving average is computed from the telemetered data.
Plots
Plots below show the averaged real time data from the duplicate systems in
black and dark blue. The annual cycle is plotted in red.
Click on any plot to expand it.
| Air Temperature (degree C) | Sea Surface Temperature (degree C) |
 |
 |
| Relative Humidity (%) | Barometric Pressure (mBar) |
 |
 |
| Shortwave Radiation (W/m2) | Longwave Radiation (W/m2) |
 |
 |
 |
 |
to Stratus Real Time Data

