
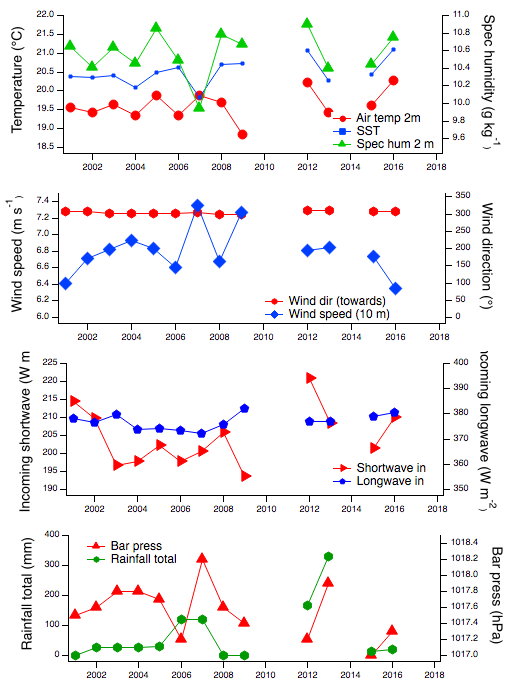
Annual Means of Stratus Reference Data Set
For information on data sources and variable descriptions, please see the information page, or mouse-over each short name in the tables below.
See also the model comparison page.
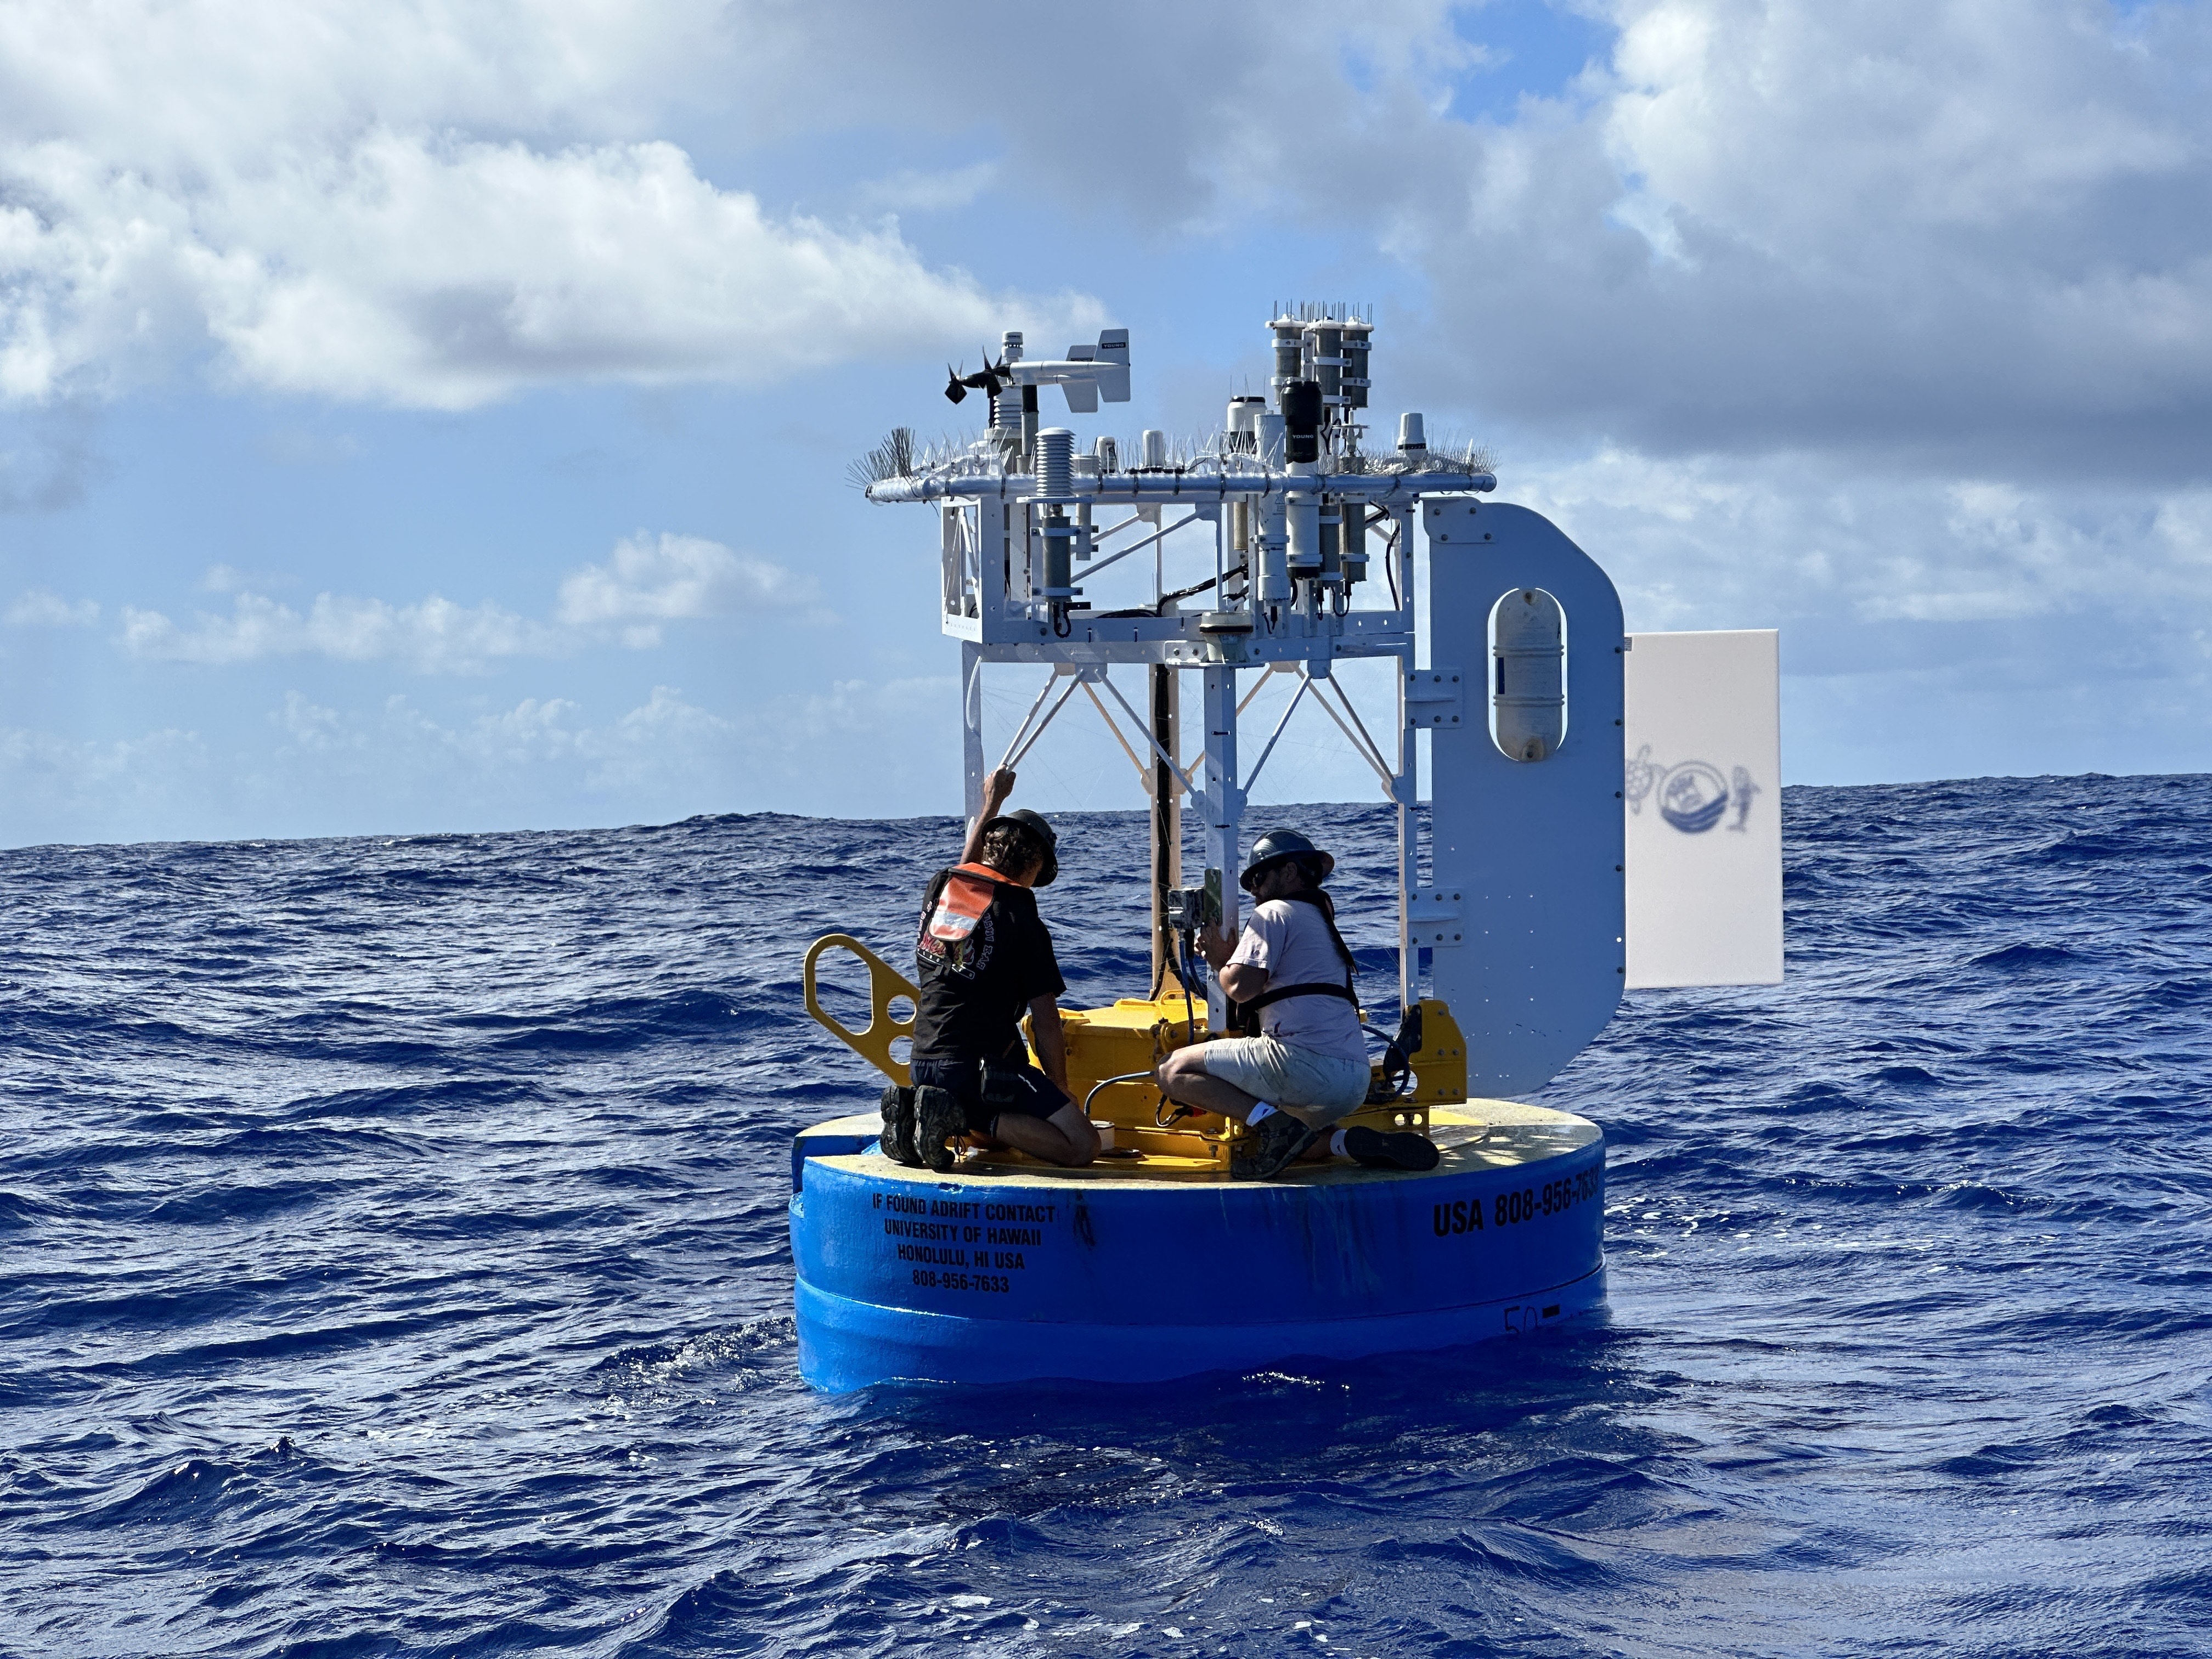
Annual mean averages for Stratus observations are seen below in red. The WHOI UOP ORS buoys recorded good observations and the WHOI UOP ORS C-Band Radar recorded local precipitation beginning in 2001. Prior to that, in the year 2000, the WHOI UOP ORS buoys recorded good observations but had to extrapolated local precipitation data from the nearby Servicio Hidrografico y Oceanografico de la Armada de Chile SHOA DART buoy 32.5 nautical miles away. There are no WHOI UOP ORS observations for 2006.
Meteorological Means
Mouse over the short name for more information about the variable.
| year | ATMP | RH | SH | SST | PSAL | WSPDsc | WSPDv | WDIR | SWR | LWR | RAINtot | BPR |
|---|---|---|---|---|---|---|---|---|---|---|---|---|
| 2001 | 19.50 | 74.9 | 10.3 | 20.39 | 35.4 | 5.9 | 5.4 | 308.0 | 214.4 | 378.3 | 1.2 | 1017.5 |
| 2002 | 19.39 | 73.6 | 10.1 | 20.37 | 35.4 | 6.1 | 5.6 | 309.1 | 209.7 | 376.8 | 25.9 | 1017.6 |
| 2003 | 19.58 | 74.6 | 10.3 | 20.42 | 35.5 | 6.2 | 5.9 | 301.4 | 196.6 | 379.8 | 25.9 | 1017.8 |
| 2004 | 19.31 | 74.5 | 10.1 | 20.10 | 35.4 | 6.3 | 5.9 | 301.4 | 197.9 | 373.8 | 27.5 | 1017.8 |
| 2005 | 19.83 | 74.7 | 10.5 | 20.50 | 35.5 | 6.3 | 5.9 | 301.2 | 202.2 | 374.4 | 29.9 | 1017.7 |
| 2006 | 19.64 | 73.2 | 10.2 | 20.63 | 35.3 | 6.0 | 5.6 | 301.7 | 197.8 | 373.4 | 121.6 | 1017.2 |
| 2007 | 18.79 | 73.0 | 9.6 | 19.84 | 35.3 | 6.8 | 6.5 | 305.3 | 200.5 | 372.1 | 119.6 | 1018.2 |
| 2008 | 19.92 | 73.8 | 10.5 | 20.70 | 35.4 | 6.1 | 5.6 | 297.9 | 205.9 | 375.7 | 0.0 | 1017.6 |
| 2009 | 19.79 | 73.7 | 10.4 | 20.73 | 35.5 | 6.7 | 6.3 | 297.9 | 193.7 | 382.0 | 0.0 | 1017.4 |
| 2012 | 20.18 | 73.3 | 10.6 | 21.07 | 35.5 | 6.2 | 5.6 | 309.3 | 220.8 | 376.8 | 167.2 | 1017.2 |
| 2013 | 19.38 | 73.6 | 10.1 | 20.27 | 35.5 | 6.3 | 5.9 | 310.8 | 208.4 | 377.0 | 330.9 | 1017.9 |
| 2015 | 19.58 | 73.3 | 10.2 | 20.42 | 35.5 | 6.1 | 5.8 | 308.0 | 201.3 | 378.8 | 14.5 | 1017.0 |
| 2016 | 20.22 | 72.2 | 10.4 | 21.11 | 35.6 | 5.8 | 5.5 | 307.5 | 210.0 | 380.5 | 19.9 | 1017.3 |
| All | 19.62 | 73.7 | 10.3 | 20.50 | 35.5 | 6.2 | 5.8 | 304.6 | 204.6 | 376.9 | 68.0 | 1017.6 |
Surface Flux Means
Surface fluxes are calculated using the COARE 3.5 Bulk Flux algorithm (Fairall et al., 1996, 2003, Edson et al., 2012).
Wind, air temperature, relative humidity, sea surface temperature, and barometric pressure data from the ORS buoy are used to calculate fluxes. In addition, shortwave and longwave radiation data from the ORS buoy are used to calculate Qs, Ql, and Qn.
Mouse over the short name for more information about the variable.
| year | ATMP | SH | WSPDsc | WSPDv | QB | QH | QN | Qs | Ql | WSSsc | WSSv | WSSd |
|---|---|---|---|---|---|---|---|---|---|---|---|---|
| 2001 | 19.55 | 10.7 | 6.4 | 6.4 | -7.2 | -95.6 | 59.4 | 202.7 | -40.5 | 0.065 | 308.0 | 308.0 |
| 2002 | 19.44 | 10.4 | 6.7 | 6.7 | -8.2 | -105.8 | 42.3 | 198.2 | -41.9 | 0.069 | 308.6 | 308.6 |
| 2003 | 19.63 | 10.6 | 6.8 | 6.8 | -6.9 | -100.8 | 38.9 | 185.8 | -39.2 | 0.075 | 301.6 | 301.6 |
| 2004 | 19.35 | 10.5 | 6.9 | 6.9 | -6.6 | -99.6 | 37.5 | 187.0 | -43.3 | 0.076 | 301.2 | 301.2 |
| 2005 | 19.88 | 10.9 | 6.8 | 6.8 | -5.1 | -98.2 | 42.8 | 191.1 | -45.0 | 0.076 | 302.1 | 302.1 |
| 2006 | 19.69 | 10.5 | 6.6 | 6.6 | -7.9 | -106.9 | 25.6 | 186.9 | -46.5 | 0.069 | 301.9 | 301.9 |
| 2007 | 18.84 | 9.9 | 7.4 | 7.4 | -10.3 | -116.2 | 19.6 | 189.5 | -43.5 | 0.091 | 306.1 | 306.1 |
| 2008 | 19.97 | 10.8 | 6.7 | 6.7 | -6.1 | -102.7 | 41.0 | 194.5 | -44.8 | 0.072 | 298.1 | 298.1 |
| 2009 | 19.84 | 10.7 | 7.3 | 7.3 | -8.5 | -114.6 | 21.1 | 183.0 | -38.8 | 0.087 | 298.2 | 298.2 |
| 2012 | 20.23 | 10.9 | 6.8 | 6.8 | -7.5 | -111.1 | 44.4 | 208.7 | -45.7 | 0.074 | 309.4 | 309.4 |
| 2013 | 19.42 | 10.4 | 6.9 | 6.9 | -7.7 | -105.4 | 42.6 | 196.9 | -41.2 | 0.078 | 310.3 | 310.3 |
| 2015 | 19.63 | 10.4 | 6.7 | 6.7 | -6.8 | -105.0 | 38.2 | 190.2 | -40.2 | 0.072 | 307.7 | 307.7 |
| 2016 | 20.26 | 10.8 | 6.4 | 6.4 | -6.9 | -107.8 | 41.5 | 198.5 | -42.3 | 0.065 | 307.2 | 307.2 |
| All | 19.7 | 10.6 | 6.8 | 6.8 | -7.35 | -105.4 | 38.1 | 193.3 | -42.5 | 0.075 | 304.7 | 304.7 |
Last updated: July 5, 2018