Preliminary real-time surface flux calculations
This page displays the results of the SPURS II Buoy.
While this data is being made available, please recognize that these are
preliminary results from unedited data. We are working to include automated quality control
procedures, however at present this data is intended for use in developing the system, and
not as a resource for understanding air-fluxes at the SPURS II site.
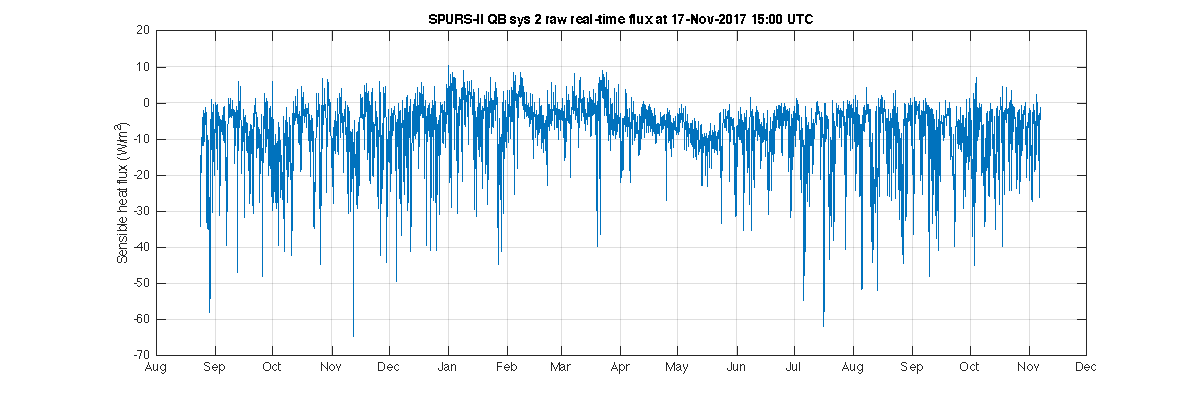
SPURS-II system 2 Flux Data
| Sensible heat flux (W/m2) |
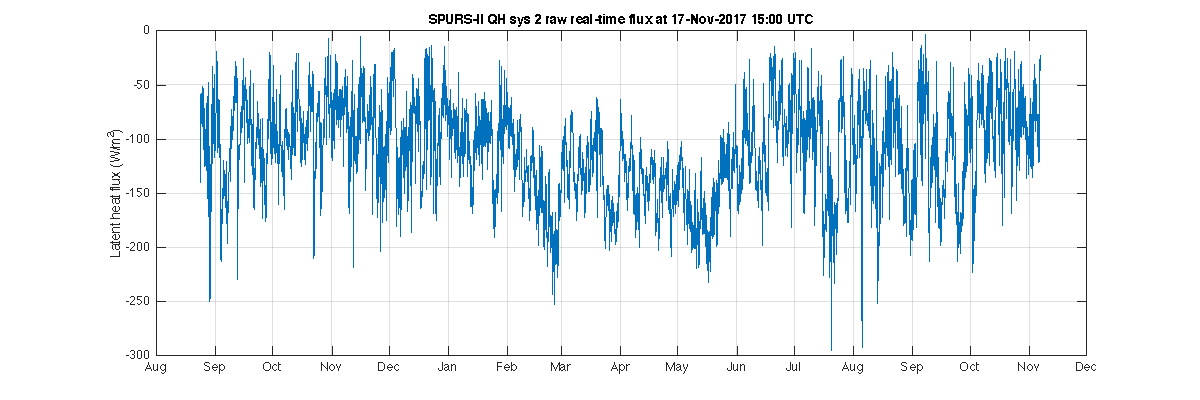
Latent heat flux (W/m2) |
 |
 |
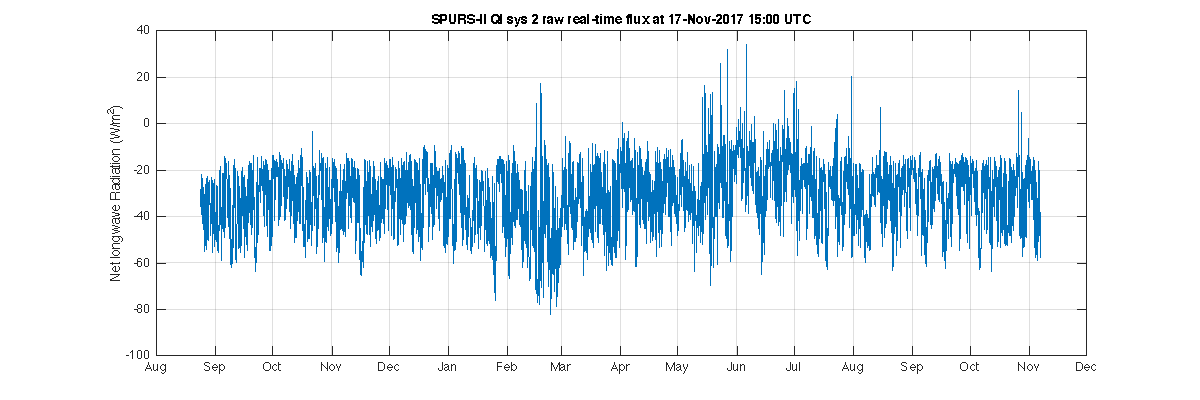
| Net longwave Radiation (W/m2) |
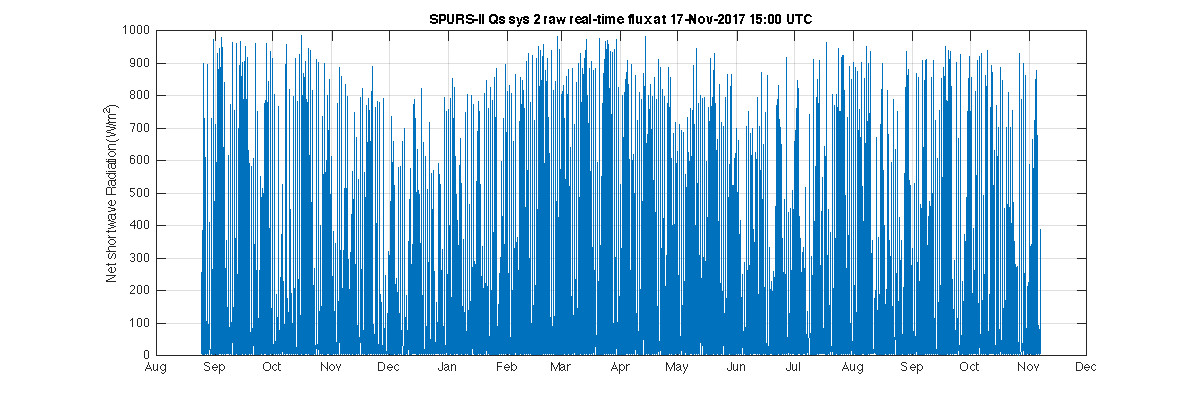
Net shortwave Radiation (W/m2) |
 |
 |
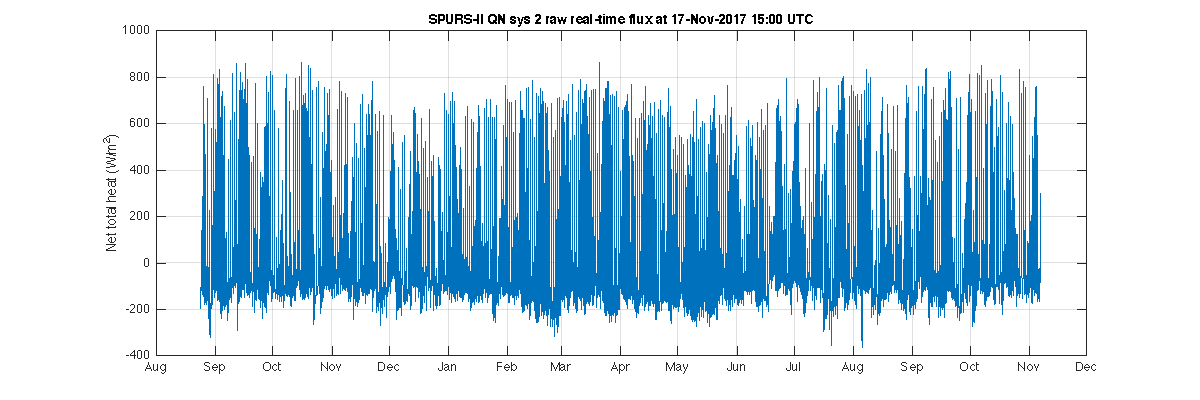
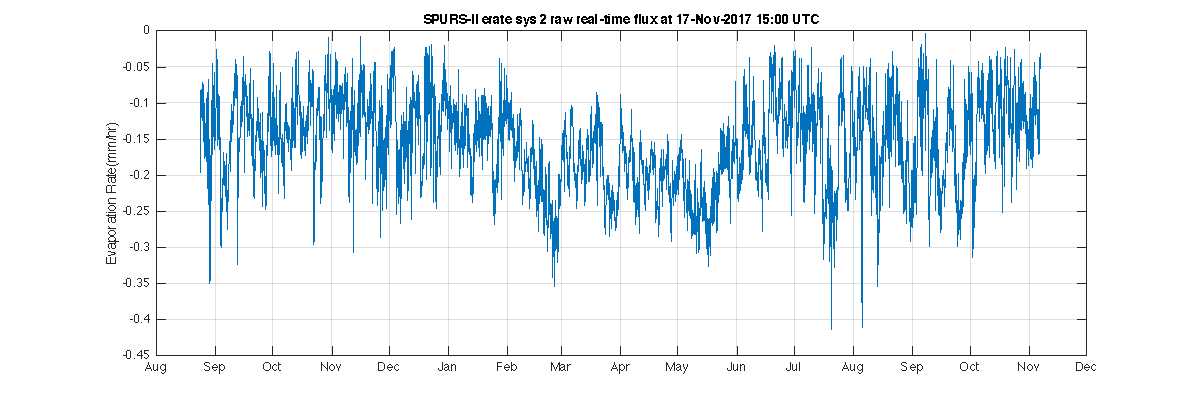
| Net total heat (W/m2) | Evaporation
Rate (mm/hr) |
 |
 |
Last updated: Dec.8, 2016


)
)
)
)
)
)