

WHOI-KAUST Red Sea mooring
| Buoy location map |
 |
| KAUST surface mooring deployed at about 38°E, 22°N |
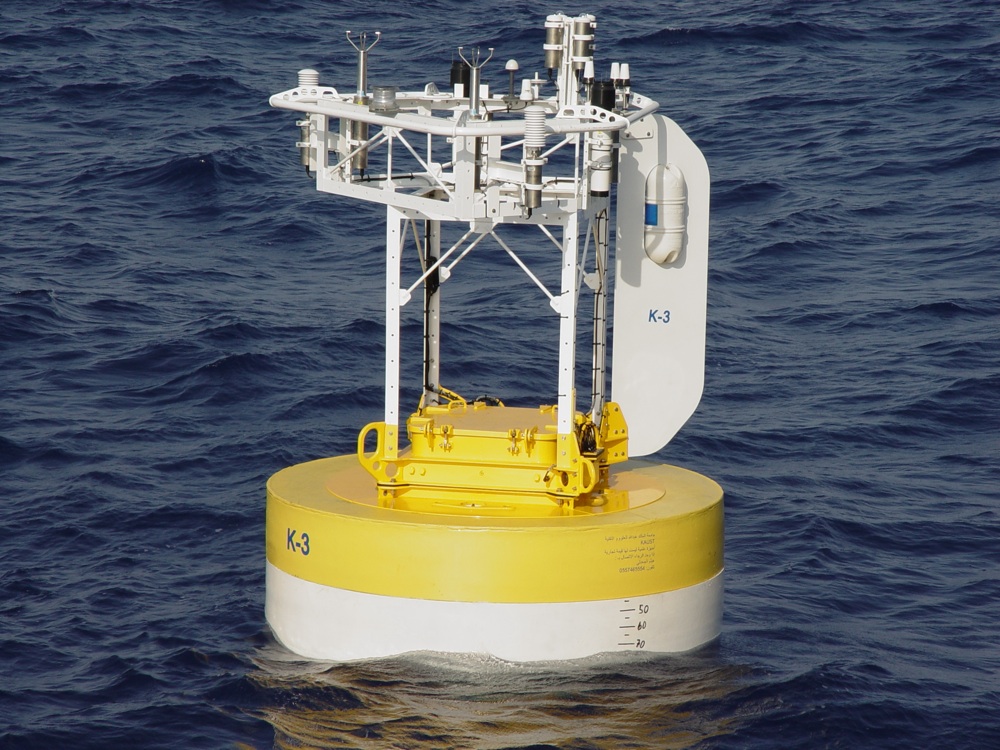
| Surface Buoy |
 |
| Mooring diagram |
Preliminary real-time surface flux calculations
This page displays the results of an experimental system to calculate surface fluxes in near-real-time using surface data from the UOP-KAUST reference station.
While this data is being made available, please recognize that these are preliminary results from unedited data. We are working to include automated quality control procedures, however at present this data is intended for use in developing the system, and not as a resource for understanding air-fluxes in the eastern Red Sea.
The KAUST-UOP buoy was redeployed on 22 November, 2009, after an initial 1-year
deployment that began 11 October 2008 at 1209 UTC. The buoy is located
at approximately 22°N, 38°E in about 700 m of water.
Current Air-sea flux calculations at Buoy
Local time is UTC +3
KAUST-II ASIMet at 0/00/00 00:00 UTC
|
)
)
)
)
)
)
)
Composite Real-time plots
- Surface flux: full time series last 5 days
Real-time surface flux text data files
An ASIMet System is transmitting data in near real time from the surface buoy using the Iridium satellite service. Real-time data is used to calculate approximate surface fluxes; files presented here contain unedited data for the latest 24 hours transmitted.
text files:
Principal Investigator:
Dr. J. Farrar, Upper Ocean Processes Group, Woods Hole Oceanographic Institution
Last updated: November, 2009