
R/V Shana Rae operations in support of April 2015 AirSWOT campaign, April 17-20, 2015
| Sponsor |
| Location |
 |
| Instrumentation |
| Oceanscience UnderwayCTD |
| Webb Research APEX Float |
| Related |
| AirSWOT at JPL |
AirSWOT Details
The RV Shana Rae sailed from Santa Cruz Small Craft Harbor at 1500 Z on April 17, 2015, deployed 3 EM-APEX profiling floats in the AirSWOT study area, carried out hydrographic sampling with the UCTD, recovered the floats, and returned to port, arriving at 1700 Z on April 20.
A draft report is available.
UCTD Casts
Underway Conductivity Temperature Depth (UCTD) casts were taken during a time period of about 2.5 days, with a geographic sampling that used straight sections. These sections are shown in Figure 1. The colors denote the different sections, with the starting point of the section represented with an open square symbol. Dots mark the locations of UCTD casts deeper than 480 dbar, and are colored by the dynamic height relative to that depth. Black X’s mark the locations of shallower UCTD casts. The gray contour is the 500-m isobath. Sections are numbered in chronological order, as they were collected. The two longest sections were about 180 km (section 1, red) and 110 km (section 2, green), while other sections were around 40 to 50 km long. Median distance between casts was 3.7 km. The first 5 m of UCTD data were not used.
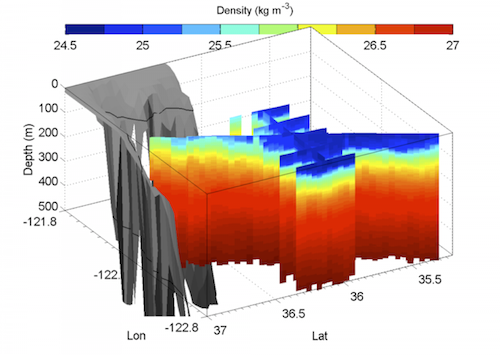
From conductivity, temperature and pressure, density was computed. A 3-dimensional view of the density anomaly, is shown in Figure 2. Casts maximum depth varied between 450 and 500 m.
A UCTD section was collected along the satellite tracks sampled by the SARAL/AltiKa altimeter on April 17, and sampling was conducted in a 40km x 40km region in a “feature survey” for the two day period. 158 UCTD casts were completed (Figure 1).
EM-APEX floats
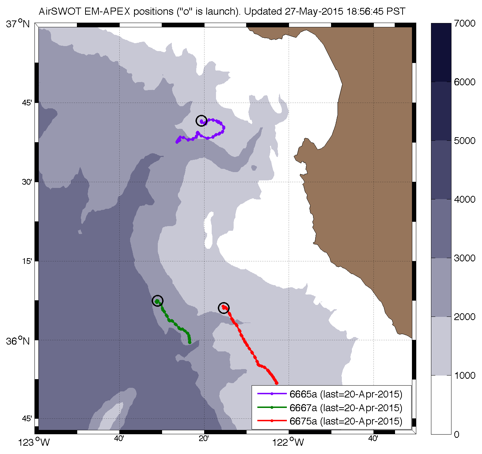
Three Teledyne Webb Research (TWR) EM-APEX (ElectroMagnetic Autonomous Profiling Explorer) floats collected timeseries of T, S and horizontal water velocity during the UCTD survey. Figure 3 shows the initial deployment locations (circles) and drifts of the three floats over the 3 day experiment.
| Float S/N | 6665 | 6667 | 6675 |
| Deploy date | 17 April 2015 | 17 April 2015 | 18 April 2015 |
| Deploy time (Z) | 18:39 | 22:56 | 00:37 |
| Deploy latitude | 36° 41.14’ N | 36° 07.77’ N | 36° 06.01’ N |
| Deploy longitude | 122° 21.24’ W | 122° 30.88’ W | 122° 15.02’ W |
| Recover date | 20 April 2015 | 20 April 2015 | 20 April 2015 |
| Recover time* (Z) | 11:35 | 04:30 | 01:30 |
| Recover latitude* | 36° 37.45’ N | 35° 59.65’ N | 35° 52.01’ N |
| Recover longitude* | 122° 26.43’ W | 122° 23.40’ W | 122° 03.01’ W |
Page updated: Nov 23, 2015