
Project NESF - New England Shelf Fluxes
| Specifications |
| ARES payoad |
| LWR |
| SWR |
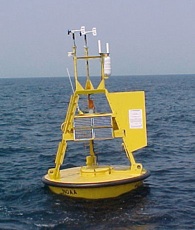
| 3-meter discus buoy |
 |
Research
NOAA's National Data Buoy Center (NDBC) has many long-term buoys equipped with meteorological and upper ocean sensors. This project seeks to augment observations on selected NDBC moorings. Measurements of surface downwelling shortwave and longwave radiation at multiple sites should enable researchers to improve flux estimates and bulk parameterizations in important ocean regions.
Instrumentation and Sampling
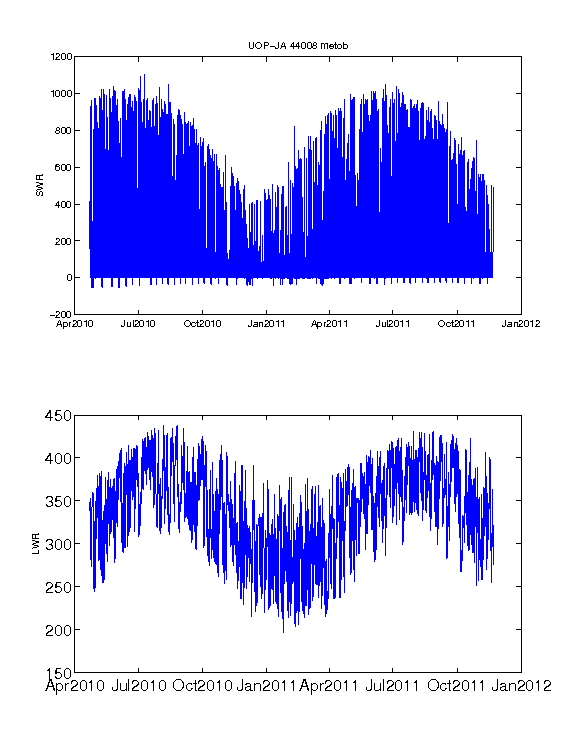
Solar Radiation Data
Shortwave Radiation Average: shortwave radiation in watts per square meter for the preceding hour. Sample frequency is 2 times per second (2 Hz). SWRAD is measured by an ASIMet SWR module employing an Eppley Precision Spectral Pyranometer (PSP).
Longwave Radiation
Average downwelling longwave radiation in watts per square meter for the preceding hour. Sample frequency is 2 times per second (2 Hz). LWRAD is measured by an ASIMet LWR module employing an Eppley Precision Infrared Radiometer (PIR).
Instrumentation and Deployments
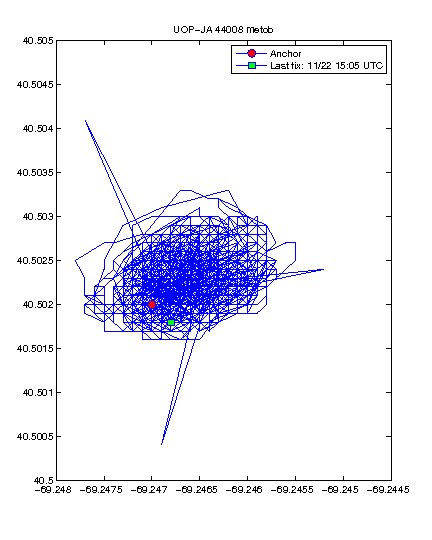
NDBC station 44008
For more information see the NDBC
Station 44008 web page.
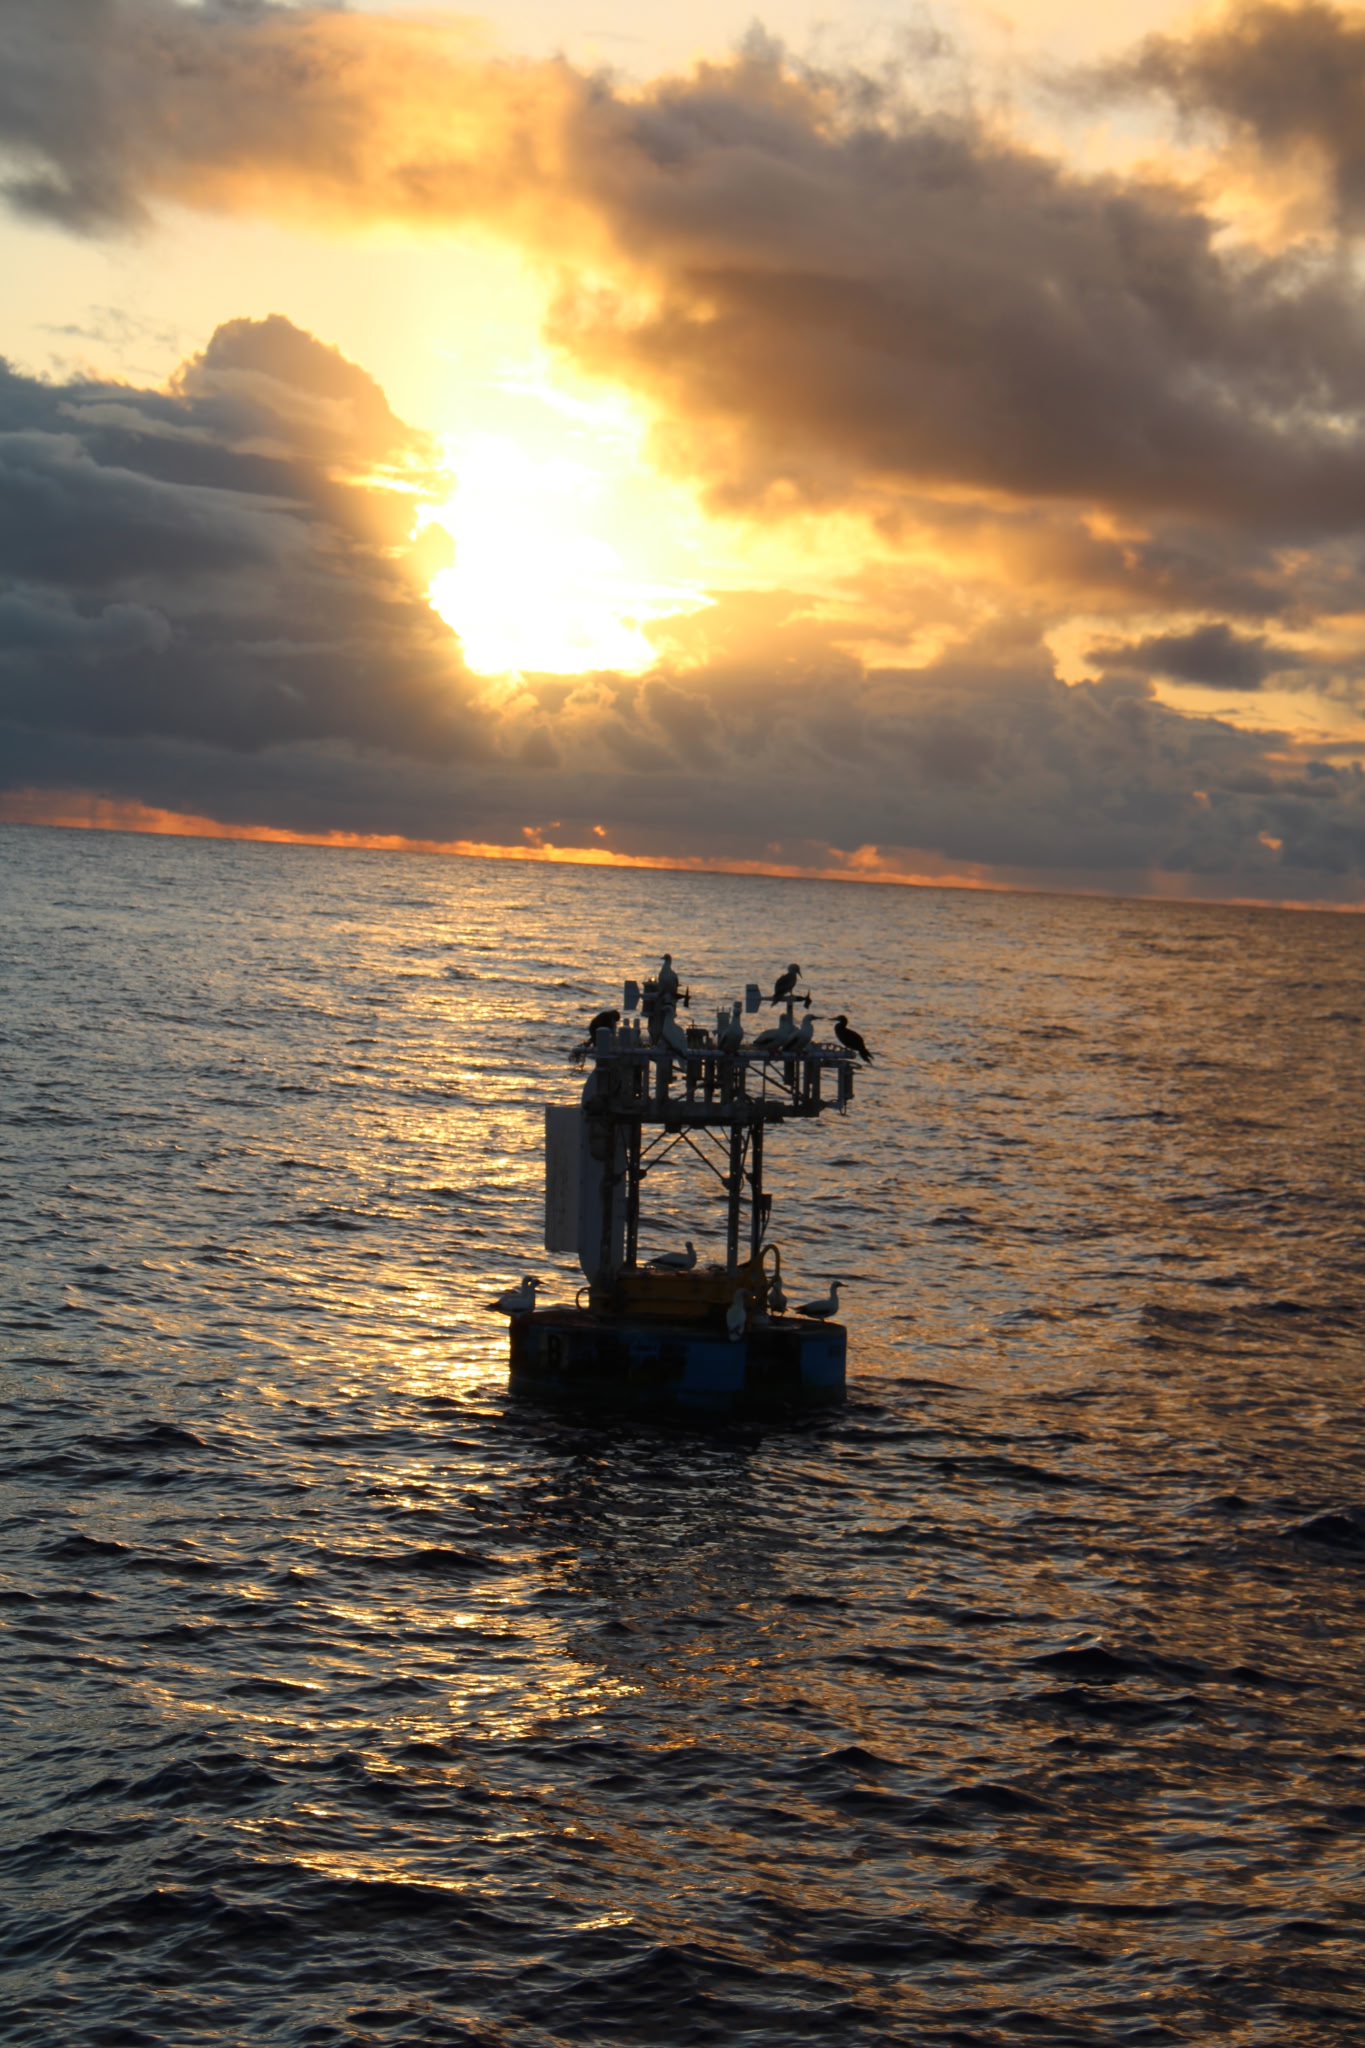
Location: 40.502 N 69.247 W - Nantucket Sound, 54 nm Southeast of Nantucket, MA
Platform type: 3-meter discus buoy with ARES payload
Deployment Date: Apr 22, 2010
Deck height: not measured
Air temp height: 4 m
Anemometer height: 5 m
Barometer elevation: sea level
Sea temp depth: 0.6 m
Water depth: 65.8 m
Watch circle radius: 140 yards
LWR SN: LWR230 Height above Deck: not measured
SWR SN: SWR230 Height above Deck: not measured
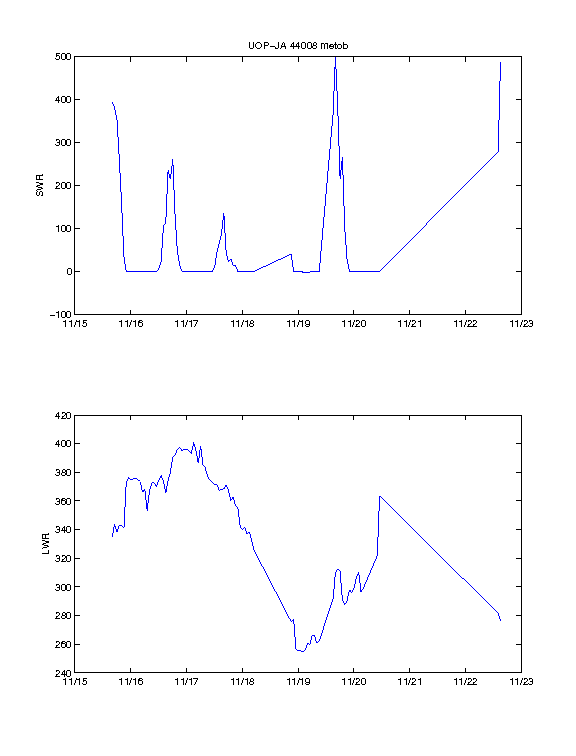
See also: full-length plot or
position plot
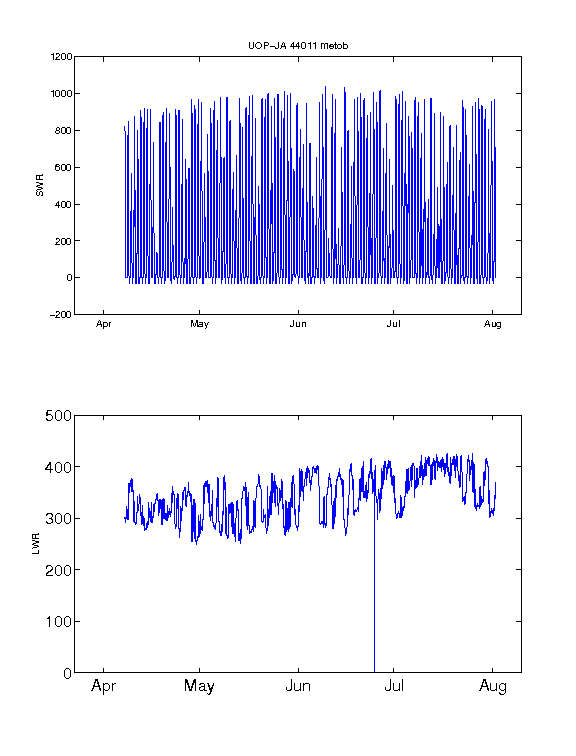
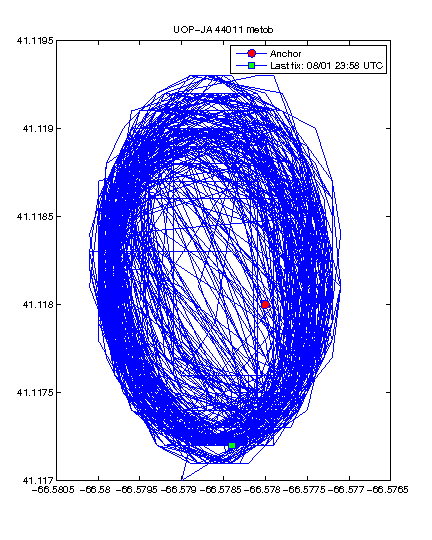
NDBC station 44011
For more information see the NDBC
Station 44011 web page.
Location: 41.118 N 66.578 W - Georges Bank 170 nm East of Hyannis, MA
Deployment Date: Apr 7, 2010
Deck height: 50 cm
LWR SN: LWR229 Height above Deck: 405 cm
SWR SN: SWR231 Height above Deck: 404 cm
Sensor level check:
SWR .8 deg. x-axis (fore=aft) and .5 deg. y-axis (port-starboard
on buoy)
LWR .6 deg. x-axis (fore-aft) and .5 deg. y-axis (port-starboard)
Deck of the buoy .6 deg. x-axis (fore-aft) and .5 deg. y-axis (port-starboard on buoy)
Note: Station 44011 stopped transmitting 8/1/10. This buoy will be restored to service when it can be worked into the NDBC schedule.
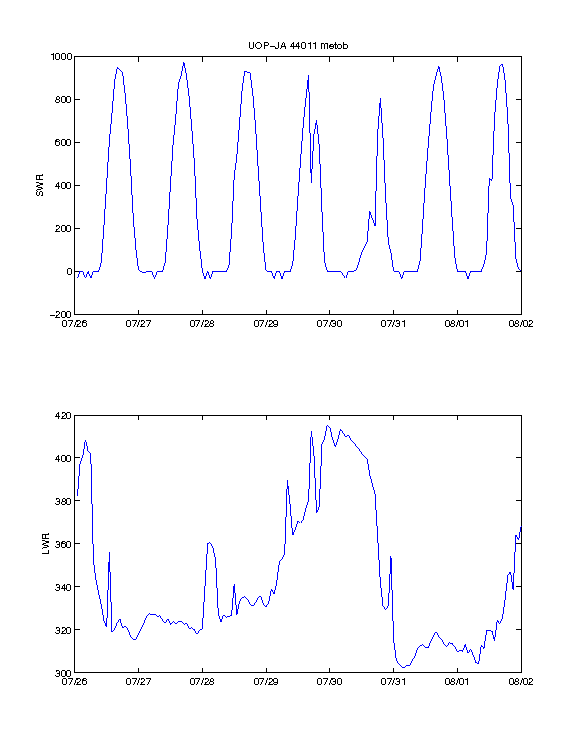
See also: full-length plot or
position plot
Data Access
Data is made available as text files at /projects/JohnAdams/data.
| station 44008 |
| station 44011 |
Files begin with comment lines that begin with % to make them Matlab-compatible.
Header lines include the name of the Matlab input file, which contains the NDBC buoy name,
the processing date, in local (Eastern) time, and the ending buoy position from the data
file. Note that east and north locations are positive numbers. There are also column header
and units lines:
% YY MM DD HH MM SWR LWR domeT caseT tpile tltmx tltmin tltmean tltstd
% w/m^2 w/m^2 degK degK volts deg deg deg deg
Fields are date (UTC), swr and lwr in W m-2 (watts per meter square), longwave dome and case
temperatures in degrees Kelvin, and longwave thermopile voltage. Also included are tilt values:
maximum, minimum, mean and standard deviation, which are included for possible troubleshooting.
Sponsors
JAII, the Massachusetts Technology Collaborative's John Adams Innovation Institute.
Text updated: December 15, 2009